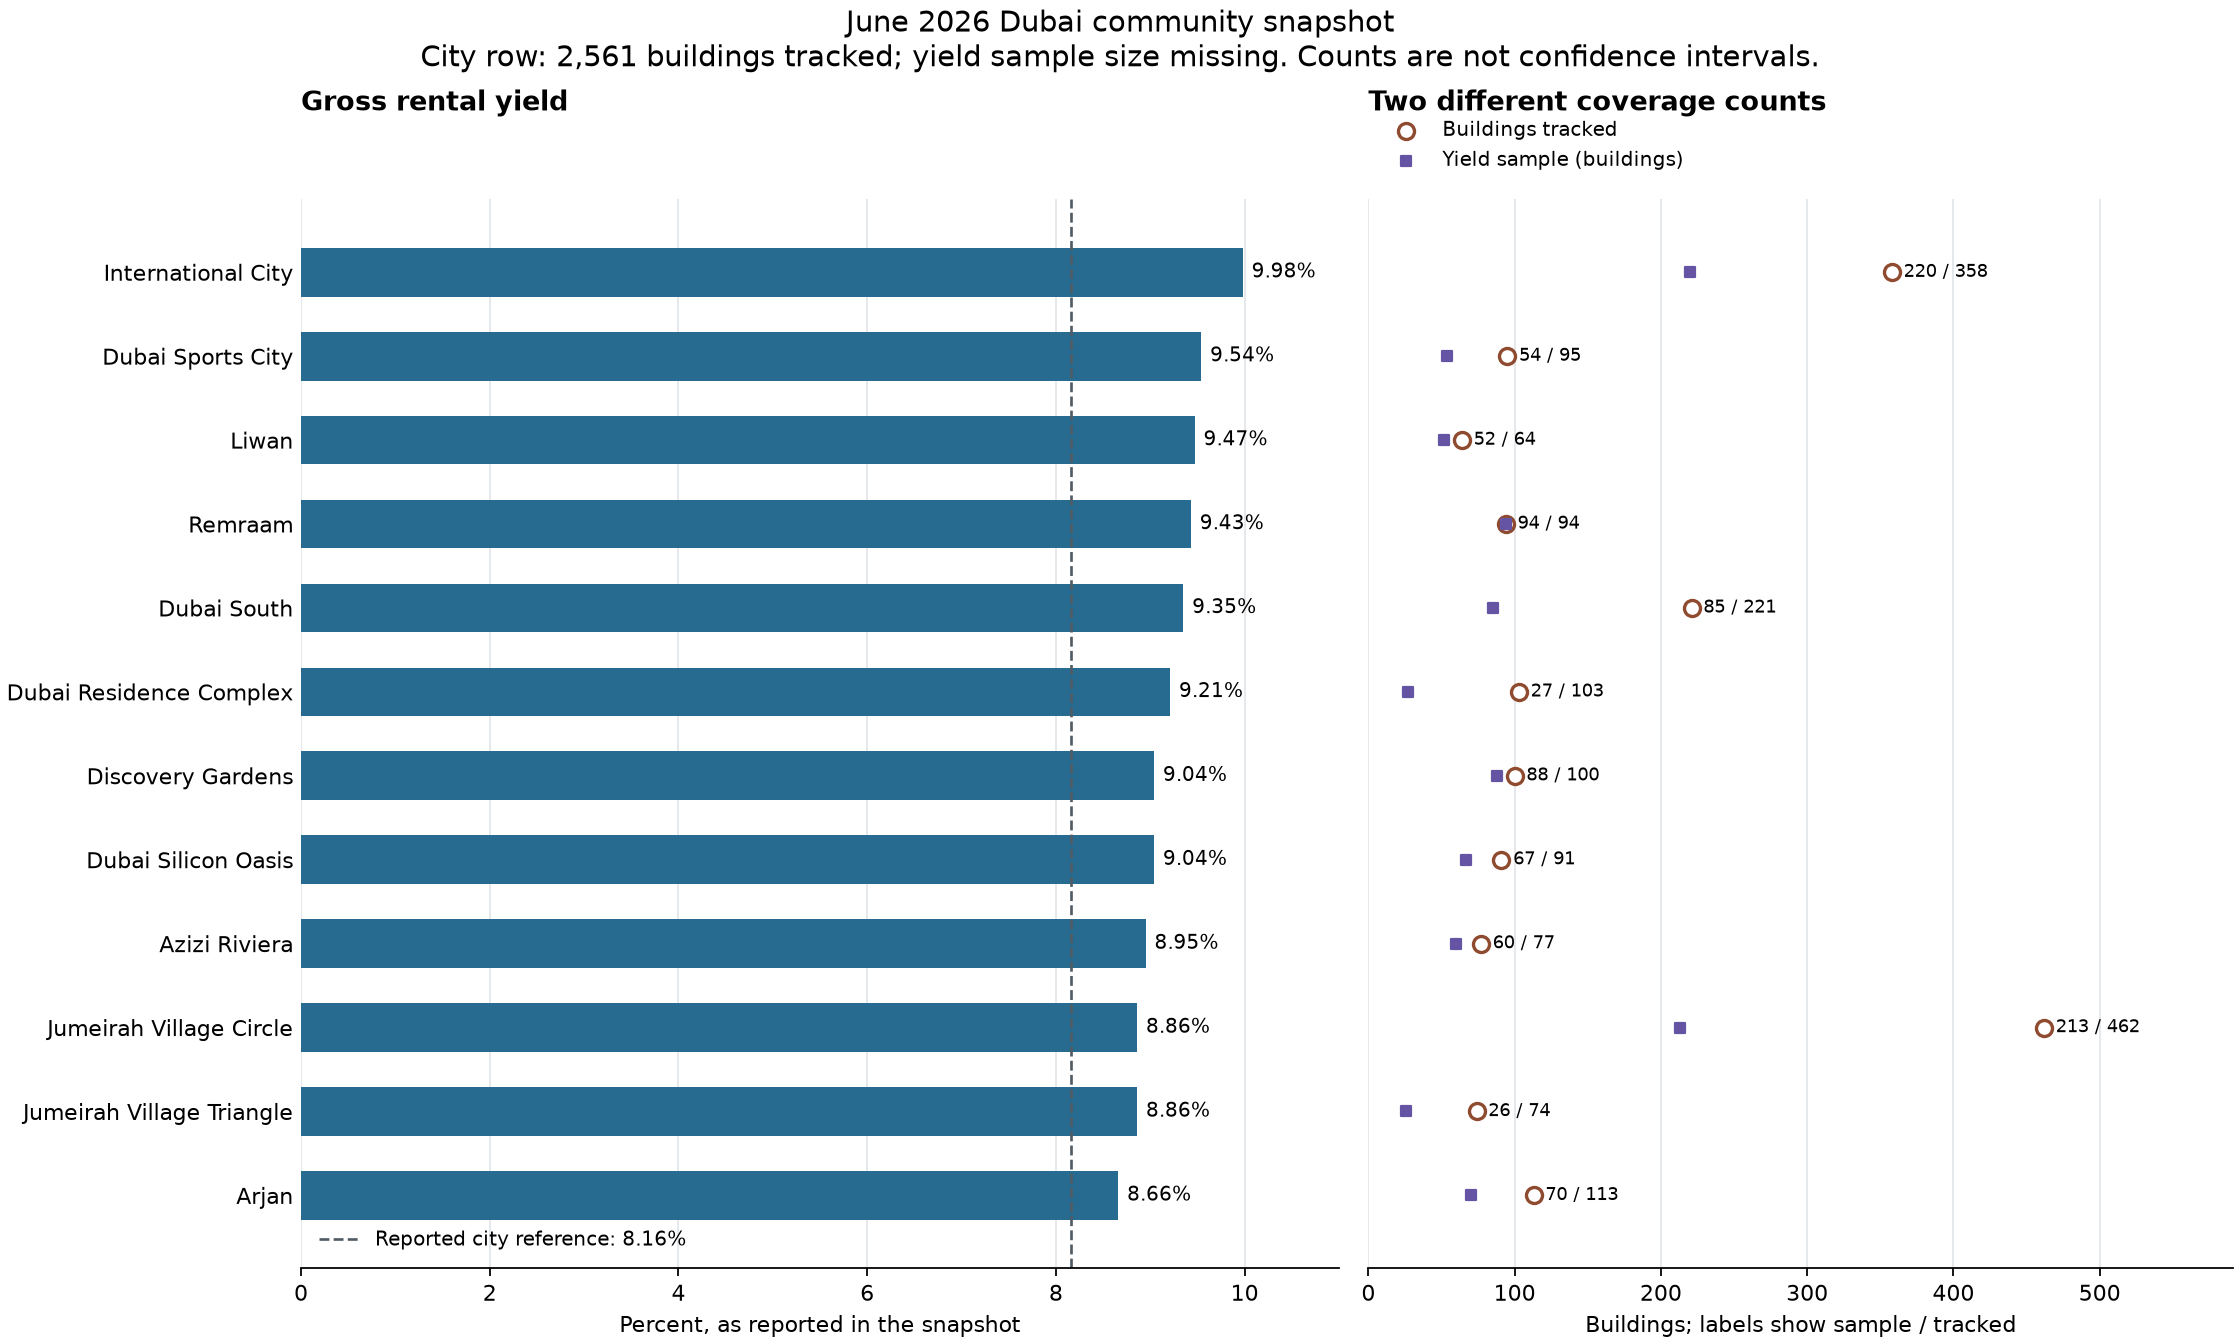
A sorted bar chart can make a small dataset easier to read while hiding the context needed to interpret it. The accompanying counts may describe different populations, an aggregate may not be the mean of the rows shown, and a blank field can disappear when converted to zero. This tutorial uses Matplotlib to keep those distinctions visible without encoding them as statistical confidence.
The example is a historical June 2026 Dubai community snapshot. Its purpose is to teach plotting and data handling, rather than to recommend properties or interpret current market conditions. The same approach works with other small tables containing a measurement and several coverage counts.
Read more...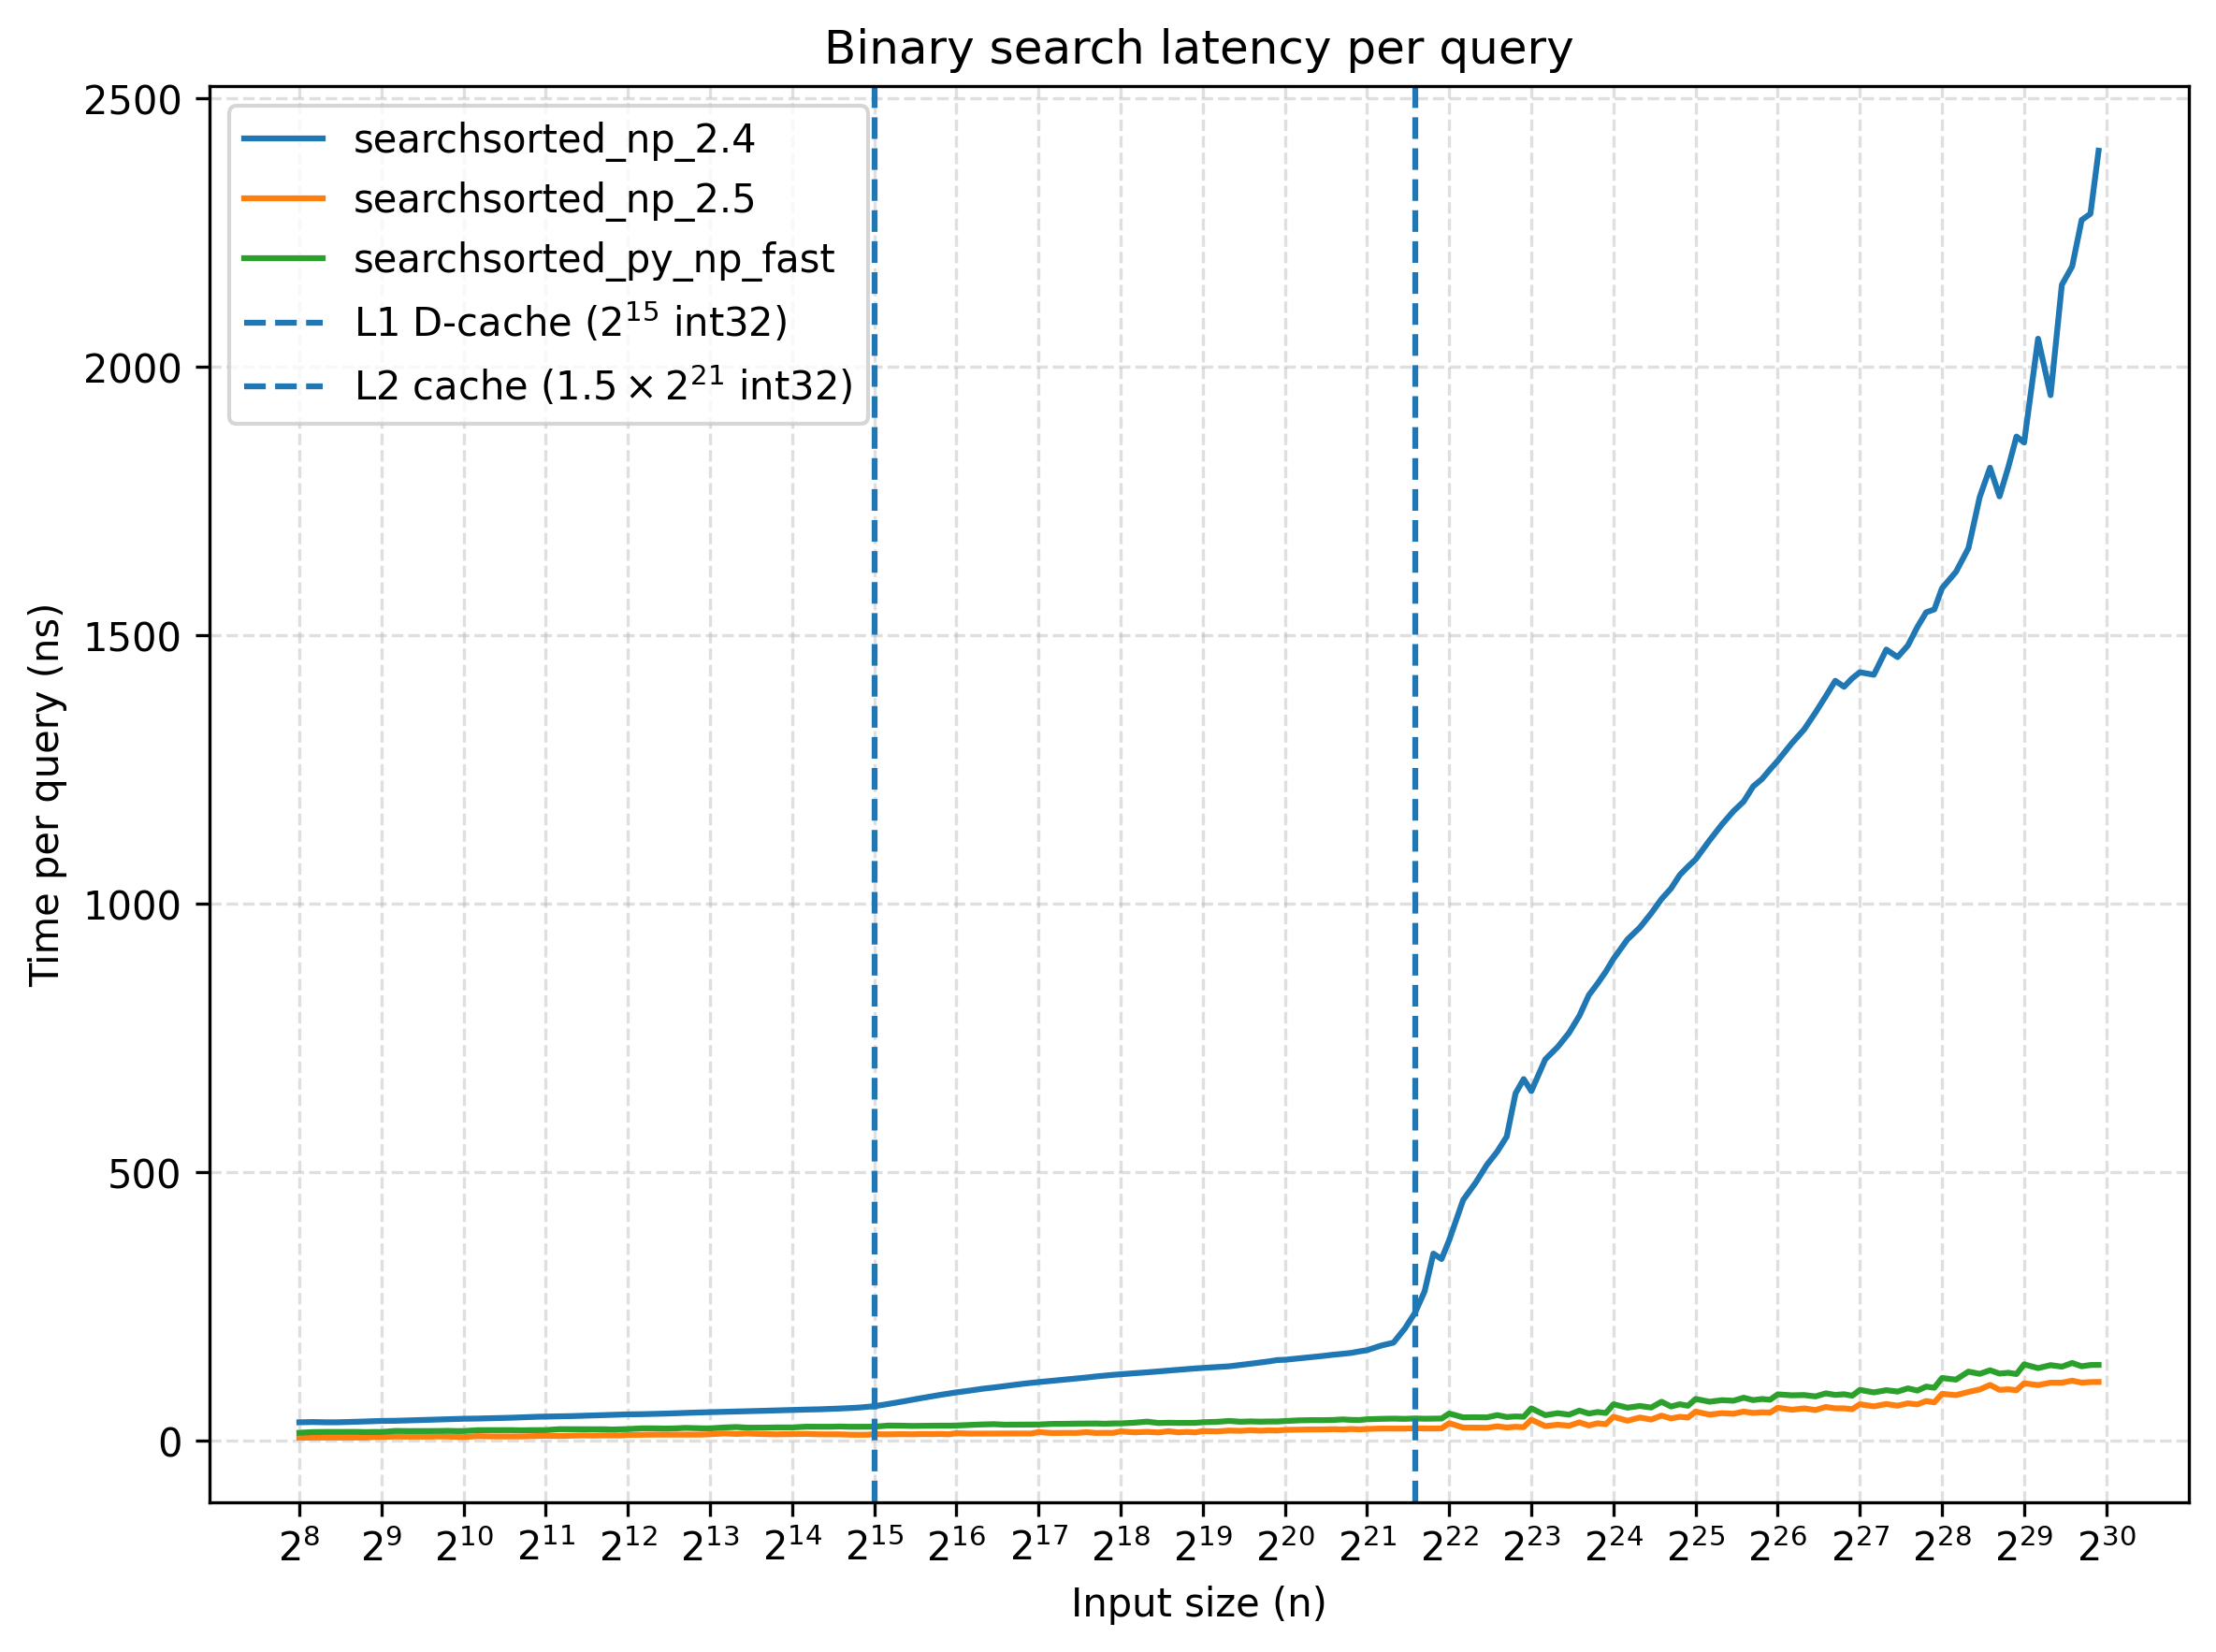 We explore how to speed up binary search by batching independent searches with NumPy’s vectorized operations. We then reformulate the algorithm so all searches progress together with only $O(1)$ additional memory, port it to C++, and achieve up to a 25× speedup over NumPy 2.4’s implementation.

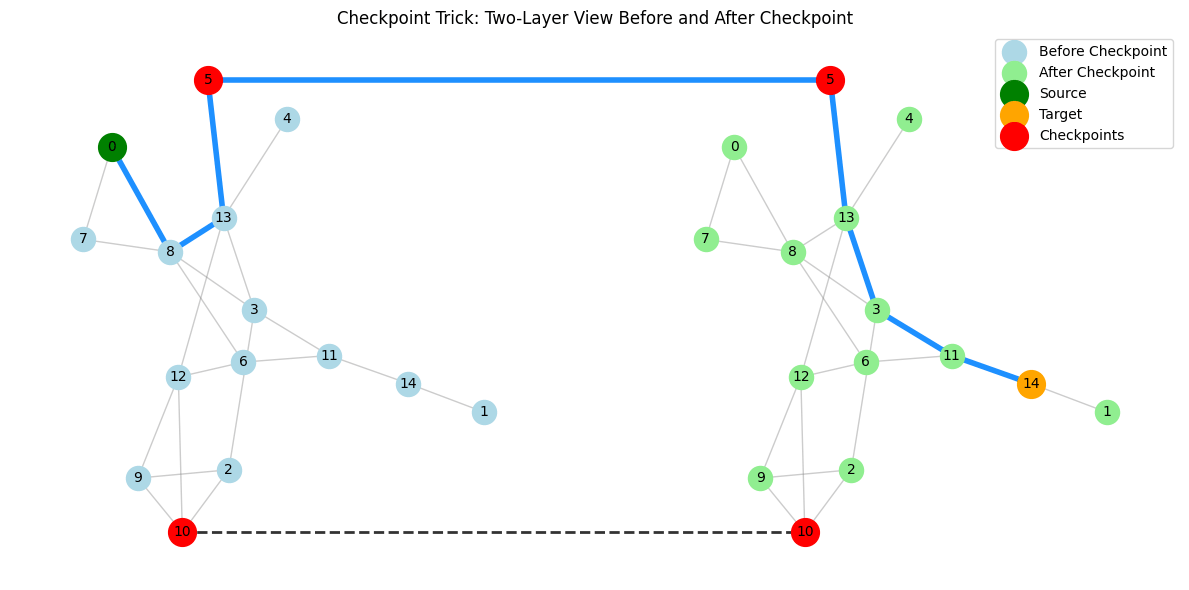 Many real-world shortest path problems include constraints that classic algorithms don’t directly handle. NetworkX provides robust, optimized implementations of algorithms like Dijkstra’s, Bellman-Ford, and A*. But what if your problem doesn’t fit the classic shortest path formulation?